

Data Science has become an essential component of the modern world, playing a critical role in driving business success and informing decision-making processes. As the demand for data-driven insights continues to grow alongside the increasing availability of data, individuals equipped with strong data analysis skills are highly sought after across various industries.
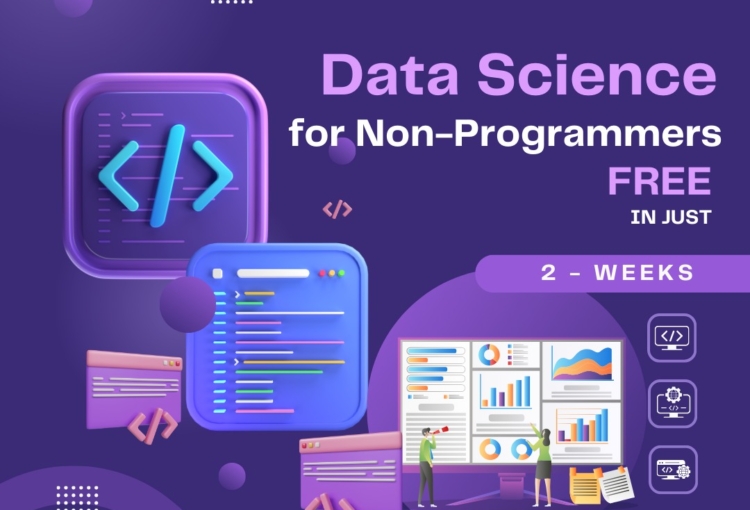
However, the field of data science can often seem daunting, particularly for those without programming backgrounds. To bridge this gap and empower non-programmers with vital data analysis skills, Nexskill is offering a free training session on Data Science during the holy month of Ramzan. Led by the experienced instructor, Rida Rafi, this training program spans over 6 hours of credit hours and will be conducted on Mondays and Tuesdays. Participants will have the opportunity to learn the basics of Data Science, so it enabling them to leverage data effectively and make informed decisions in their respective fields. Don’t miss out on this valuable opportunity to enhance your skills and expand your career prospects.
What is Data Science and its Applications?
Data Science is the interdisciplinary field that combines statistical analysis, programming, and domain expertise to extract meaningful insights and make predictions from data. It involves various techniques such as data cleaning, data manipulation, statistical analysis, and data visualization, among others.
The applications of Data Science are vast and diverse. In the healthcare industry, data science is used to identify patterns and predict disease outbreaks. In finance, so it is utilized for fraud detection and risk assessment. Online retailers use data science to optimize pricing strategies and personalize recommendations to customers. Data Science is also extensively used in transportation, social media, marketing, and many other fields where data plays a crucial role in decision-making.
Basics of Data Analysis using Excel
Excel is a widely used and accessible tool for data analysis, so making it an ideal starting point for non-programmers. In the training session, participants will be introduced to the basics of data analysis using Excel. So they will learn how to import data, clean and manipulate it, and perform various calculations and statistical analysis.
Data Cleaning and Manipulation Techniques
Data cleaning is an essential step in the data analysis process. So participants will learn the techniques to identify and handle missing data, remove duplicates, and deal with inconsistent values or outliers. They will also understand how to transform and reshape data to make it suitable for further analysis.
Introduction to Basic Statistical Analysis
Statistical analysis allows us to uncover patterns, trends, and relationships in data. Participants will be introduced to basic statistical concepts such as measures of central tendency, variability, and correlation. They will also learn how to conduct hypothesis testing and interpret the results.
Introduction to Data Visualization with Python
Data visualization is a powerful tool that enhances understanding and communication of data insights. In the training session, participants will be introduced to the fundamentals of data visualization and its importance in data analysis. So they will discover how different types of charts and graphs can be used to represent data effectively.
Overview of Popular Python Libraries for Data Visualization
Python offers several libraries that facilitate data visualization. Participants will gain an understanding of popular libraries such as Matplotlib and Seaborn, which provide a wide range of capabilities for creating visually appealing and informative plots.
Creating Various Types of Plots
Participants will learn how to create various types of plots using Python. Line plots can be used to visualize trends over time or compare multiple variables. Bar charts are useful for comparing categorical data. Scatter plots are effective in displaying relationships between two variables. So the training session will cover the step-by-step process of creating these plots.
Customizing and Styling Plots for Effective Communication
Communication plays a vital role in conveying insights from data. To make data visualizations more impactful, participants will be guided on customizing and styling plots. So they will learn techniques to choose appropriate colors, fonts, and labels that align with the intended message.
In conclusion, the free training session on Data Science offered by Nexskill during the holy month of Ramzan aims to empower non-programmers with essential skills in data analysis. Participants will be introduced to the basics of data analysis using Excel, including data cleaning and manipulation techniques. They will also gain an understanding of basic statistical analysis and the importance of data visualization.
With an overview of popular Python libraries for data visualization, participants will have the opportunity to create various plot types and learn how to customize them for effective communication of insights. By bridging the gap between non-programmers and data science, so this training session provides a valuable opportunity for individuals to enhance their skill set and harness the power of data analysis in decision-making processes.